WeConsume - A little bit of a change...
22 Feb 2021 - Jake Sherwood
 WeConsume Trailer
ITP Thesis Spring 2021 Trailer
The back story and progress…
After diving deeper into my original concept, I found myself becoming more and more disenchanted.
Was it the roadblocks, was it the limited application of blockchain, or just a weak narrative?
I wasn’t really sure, I was just sure I was beginning to feel a bit of loss of ambition for the project.
Luckily my good buddy Joey Lee, offered a fresh perspective, mixed with some amazing insight and suggestions.
To take a few steps back, I felt like I had a pretty solid implementation plan laid out and I was ticking things off.
Private Bitcoin network setup, check. SQL installed, database, schema and tables created, check. Where I started to get into some trouble was the APIs.
My first plan was to use an API by a company called Finicity that would allow me to tie into my financial institutions and track my spending. I set up a developer account and tested a few API calls on their test data but when I reached out inquiring about full API access they said the couldn’t provide me full access unless I had and incorporated company and signed an NDA. So that was out. My second problem was the CO2 estimator API, CoolClimate had restricted access and my request for access has yet to be answered.
I was worried about how to progress and I mentioned my struggles to Joey, who immediately offered to chat it over.
Having discussed my thesis with him before, after a brief reminder / pitch of my idea he initially had some great feedback. We went on to chat about it for over an hour!
Joey quickly suggested that maybe the data collection part was the least exciting. He was gravitating more to the idea of my consumption being tracked in a way that could be public and the visuals being a daily reminder of why I do this, Jackson.
The idea to simplify the data collection aspect really resonated with me. It was proving to be difficult and I completely agreed that it wasn’t very exciting, nor did I really enjoy doing it. I mean there are a million ways to collect data but is that really what I wanted this project to be about?
Also, Joey pointed out that decisions simply based on numbers and 1s and 0s, aren’t always the best. There are circumstances and explanations of why certain things happen that don’t always get reflected in the “numbers.”
So, I’ve decided to make a slight change in how I’m going to build out this project.
It will remain about consumption and emerging technologies, but will lean more into the narrative of why do I, or why do We, attempt to live in a positive way. What motivates us to go on?
I will drastically lessen the data collection aspect, simplifying to only a Google form (still TBD) that tracks to a spread sheet. I will use the data in the sheet to calculate, even if manually my estimated emissions for that day.
Those consumption patterns and resulting emissions will be written into my private Bitcoin blockchain. I will develop a custom block explorer pointed to my private BTC network and expose my consumption patterns on a publicly accessible website. Included on the website with be visuals of my consumption as well as extra informational links explaining how these emerging technologies could help.
My consumption behavior will still be calculated to a daily estimate which will be checked against a daily threshold based on the Paris agreement and other climate goals.
Further research into reaching the goals set in the Paris agreement, suggest individuals need to limit their emissions to 1.5 tCO2e. A reduction of that much poses pretty significant sacrifices for most of us.
Last semester my consumption or carbon budget was estimated to be 18.8 tCO2e vs the 16.2 national per capita. Revisiting the CoolClimate calculator I was able to recalculate my emissions to a more realistic level. I took 1/3 of some of my expenses (since I’m a family of 3) and fine tuned some advanced settings to remove a number of preset values that didn’t apply, I came in at a 8 tCO2e / year. (Again pointing to inefficiencies in the current tools…)
That number is much closer to what I’d expect due to my current behaviors (walk/skate/bike most places, vegetarian, reduce reuse etc). If I take myself as an example, a “climate conscious” individual or base level consumer “jakeN” and expand that out to 10 million versions of “jakeN” how do the actions of more conscious individuals compare to those taking less action, jakeN+1 (jakeN plus drives due to less mass transit)? How does impact look at jakeN, jakeN+1, or jakeN+4 extrapolated out to larger scale.
In an effort to not be all doom and gloom, for this project, I plan to set a personal goal of being at or below ≈ 4 tCO2e.
I also plan to explore latten space visuals, which is something I already have experience with and would enjoy developing further. I am looking into using NYU’s HPC. That would let me create more exact latten walks.
These visuals will paint a much more powerful and ephemeral feeling. After all no one knows what the future will look like. A latten space walk of images of vibrant, cool color, and surreal lush landscapes could portray positive actions and consumption inline with goals. Conversely a latten walk with less saturated, warm color, and dessert landscapes could be used when the consumption is over set goals.
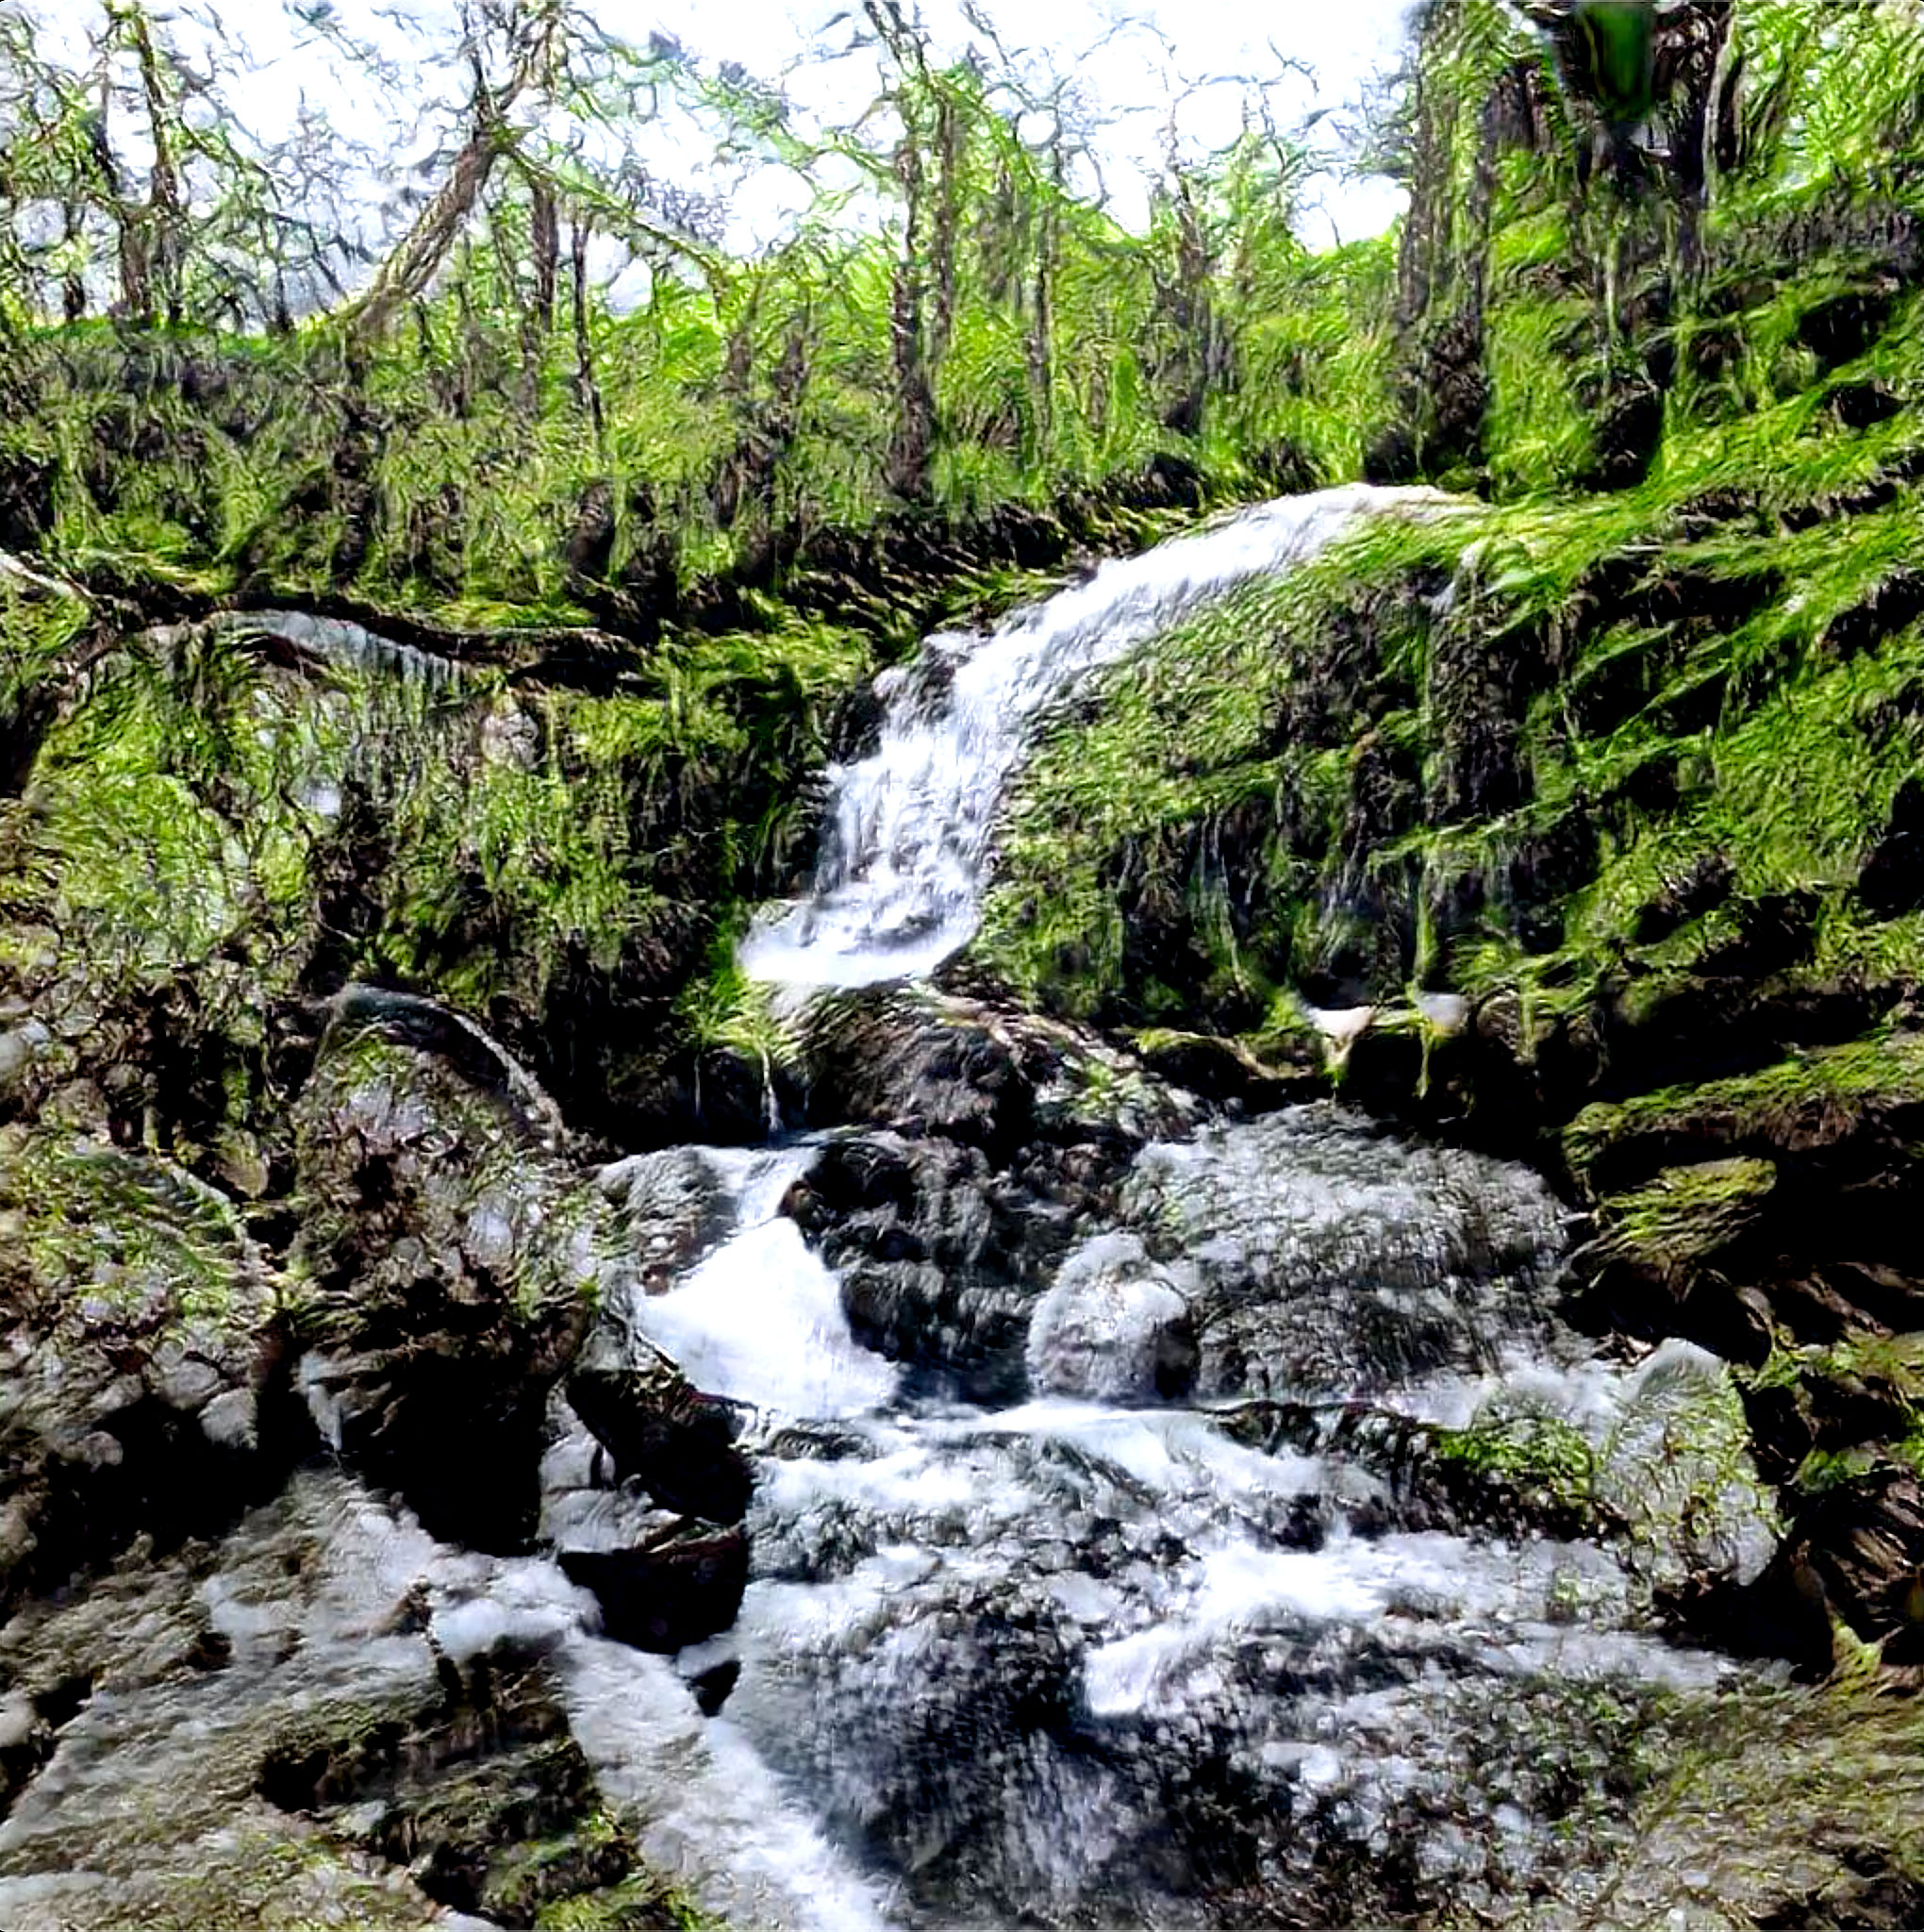 Latent walk StyleGan visualization of conscious consumption
 Latent walk StyleGan visualization of over consumption
I plan to also potentially explore the use of text generation to generate “Future Headlines” based on my consumption. These headlines may also be written to the block chain and could be used in the visual displays.
So I am sticking with the general premise and everything I’ve researched is still very applicable, I’m just going to move away so much from data collection and focus more on a personal narrative of what motivates my positive behaviour. As well as the effect of multiple people acting progressively less conscious and what effect that has on the planet.
The basic functionality will be the same, Business as Usual (Raspberry Pi 1) will win the blocks for the day if I am above the goal value, The Future Conserver (Raspberry Pi 2) will win the blocks meeting the goal or below and adjusting the visuals appropriately. I am thinking that I will consolidate into one screen. Dana had a good point that 2 may not be necessary.
The future is import to me, Jackson’s future is important, and so is everyone else’s that is inheriting this mess. We all need to be more climate aware and conscious and this project aims to provoke people to think more about their individual actions. They do matter.
Updated Implementation plan:
Feb
Week 1:
Research APIs- Database
DONE -
set up database - DONE -
set up private bitcoin network (regtest)
Week 2:
Finalize APIs- Database
DONE -
finalize data structureDONE -create tablesload sample data / feed in data if available - DONE -
rough prototype
Week 3:
- REVAMP THESIS PLAN - Less data collection MORE Narrative
- DONE -
test various bitcoin-cli (OP_RETURN to write message to the chain) on regtest nodes - start to think about visuals:
- 3D, abstract, matrix code text leaning towards Matrix style raining text / code overlaid on top of 3d objects
- use latent walk StyleGans
Week 4:
- Set up block explorer
- look into HPC Stylegans / GPT2 text generation
- set up Google form / sheet / scripts for data collection.
- catch up on previous items not completed
March
Week 1:
- research and compare emissions, goals and effects of jakeN etc
- start tracking with Google form
- catch up on previous items not completed
fabricate visuals screens- screens still haven't shipped 😬
Week 2:
- set up scripts to modify difficulty on nodes - figure out how to use mining and rewards in visuals
- refine latent walks and GPT2 text generation
Week 3:
- build website to display consumption visuals and blockchain data
- start visualizing consumption
- fabricate visuals screens 🤞
Week 4:
- confirm daily consumption and set winning node
- fabricate visuals screens 🤞